WATER

Water covers 70.9% of the earths surface(1). Of course we know that Salt water covers much of the Earth making up our Oceans; roughly 97% of the worlds water is in the ocean; the remainder can be found in fresh water lakes, rivers, ponds, underground, and in living organisms. Also, roughly 70% of the worlds water is used for agriculture.
Unfortunately, ocean water is not good to drink and can make people very sick; salt water is very expensive to clean to the acceptable drinking levels. In the past, access to drinking water was very bad and has improved greatly around the world. This can be reflected in the fact that most developed countries have access to safe drinking water while many poor or underdeveloped countries do not.
One report(2) has shown there are still many people world wide that do not have access to safe drinking water. Places like Chad only report 42% of the population as having access to safe drinking water in 2004. Some additional noted countries are; 54% of total population in Haiti, 41% of total population in Cambodia, and 47% of Fiji. The United States of America reports 100% of population access. the entire breakdown of this data can be seen by clicking on the hyper-link below.
Safe Drinking Water Data

The above map shows countries and the level of outbreaks of water-borne illnesses. this is important because contaminated water can greatly affect a community or even an entire country through illness or even death. Water can become contaminated by many things from microorganisms, radiation, to biologic or fecal matter. the later is one of the most common and most prolific; the above map shows this type of contaminant. Often this is most common in less developed countries and those areas that do not have readily available clean water, but even the United States has issues with contaminated water as can be seen in the map.
Water is vitally important to life and all humans need water to survive. Unclean water can further decrease the health of people who are already living in poorer or less developed places. There are already many without clean water as has been shown and it is believed that there will be water deficiencies that continue in the near future if new ways to give everyone access to clean water.
SOIL
Soil is what makes up the "turf" of the world we live on. It is made up of layers of minerals of different sizes, shapes, chemical makeups, and physical characteristics(3). different levels of minerals, moisture, and nutrients can vary soil compositions and can be seen in the picture below. The variations of minerals lead to soils that are good for agriculture and others that are good for raising livestock. Still there are others that are not so good for either because the soil composition cannot support plants or livestock.

Historically, farming and agriculture grew up and sprout along rivers and other bodies of water, hence civilizations grew up along those same regions. This was because the land around bodies of water could be made more fertile due to the easy access of water without needing to carry water long distances. With the development of better technology and irrigation systems, humans could move further away from natural bodies of water and continue to cultivate the land. still there are soils that where less viable for agriculture and the map bellow shows a good breakdown of what the soil of the earth is used for today.
INDUSTRY
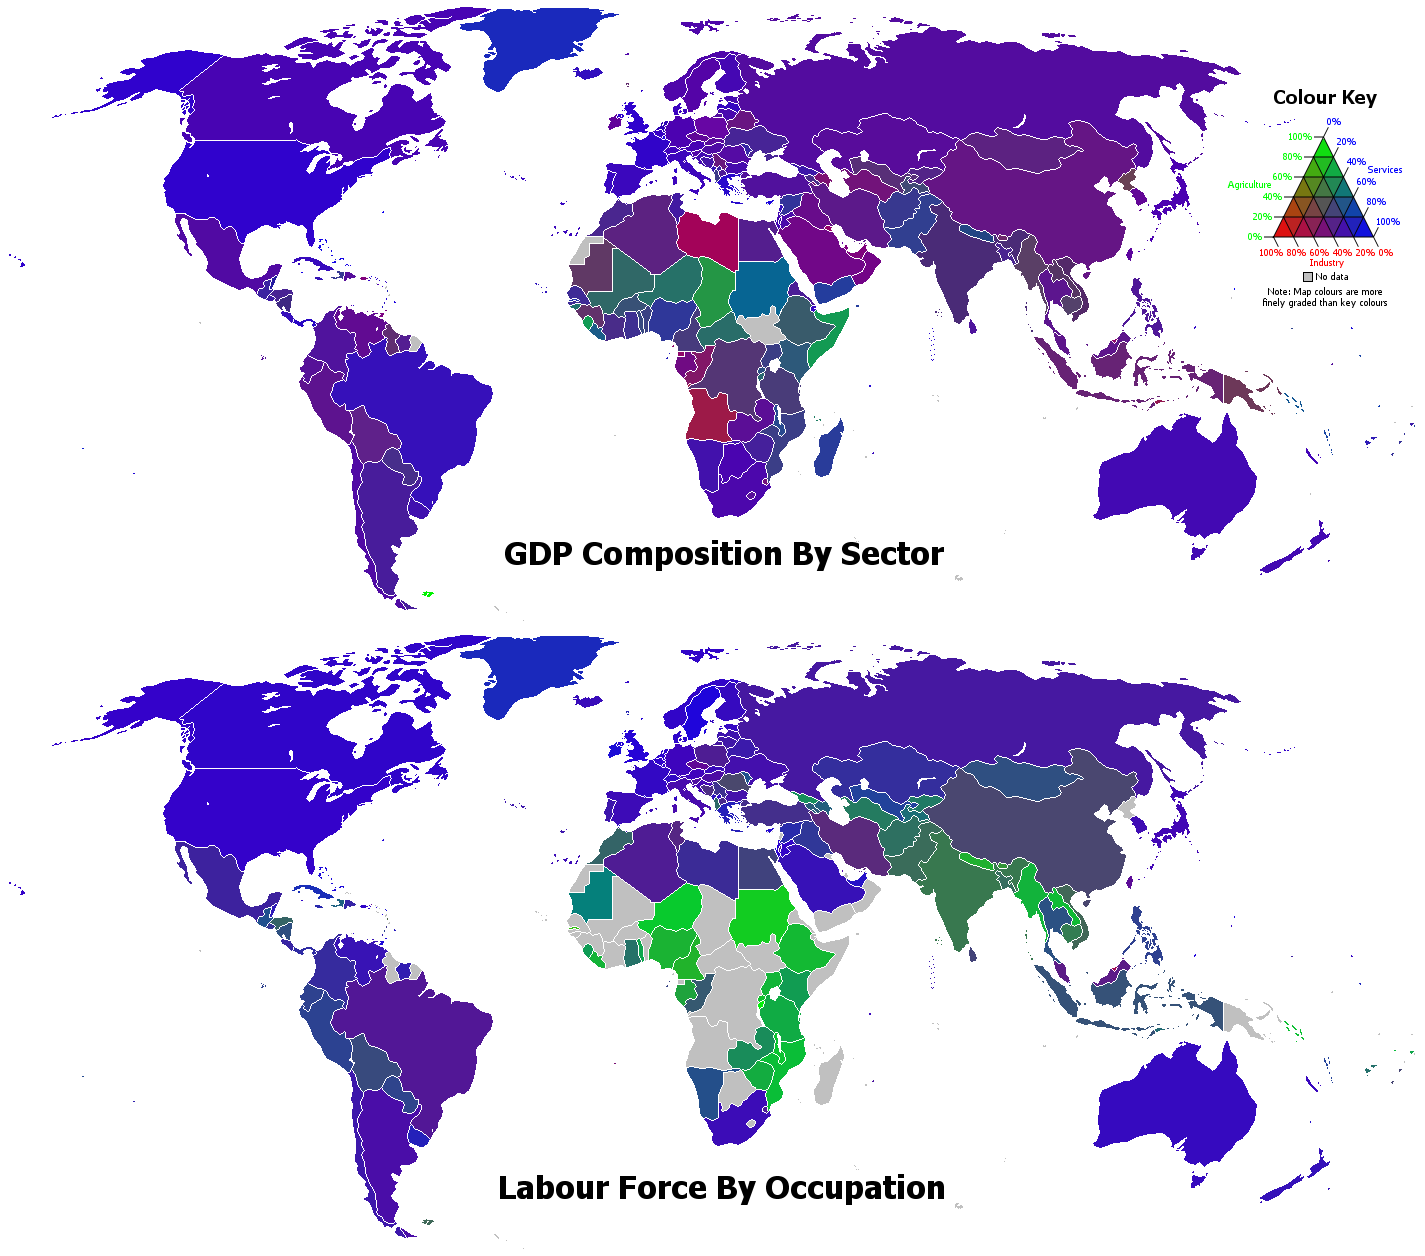
Industry creates goods or services that can be sold to generate a profit either for an individual or a country. around the world we trade goods and services and every place in the world has something different to offer. As might be expected many traditional industries such as agriculture and other services are located in countries with lower gross domestic product (GDP) and in places that have traditionally been underdeveloped. Countries that are highly developed and have large GDP often have high tech industry developing things like computers or automobiles. some traditionally based industries are countries like Chile, argentina, or many African nations. Some high tech industry nation are countries like the United States, Australia, or Germany. The map below can give you a better understanding of some of the industry differences across the world and the labor force differences.
POPULATIONS
Bellow are the 10 largest world populations by country(4) in 2010
1. China - 1,330,141,295
2. India - 1,173,108,018
3. United States - 310,232,863
4. Indonesia - 242,968,342
5. Brazil - 201,103,330
6. Pakistan - 177,276,594
7. Bangladesh - 158,065,841
8. Nigeria - 152,217,341
9. Russia - 139,390,205
10. Japan - 126,804,433
Below are the 10 most populated cities within the United States(5)
1. New York City - 8,175,133
2. Los Angeles - 3,792,621
3. Chicago - 2,695,598
4. Houston - 2,099,451
5. Philadelphia - 1,526,006
6. Pheonix - 1,445,632
7. San Antonio - 1,327,407
8. San Diego - 1,307,402
9. Dallas - 1,197,816
10. San Jose - 945,942
Isolated Tribes around the world(6)
As this video shows, there may still be places in the world where isolated tribes have not or prefer not to com in contact with the modern world. This video was from a tribe in Brazil but there are thought to be many around the world. Tribes such as the Sentinelese tribe in India or the Carabayo tribe in Columbia. Some of these tribes do not wish to have contact with the outside world and some will even violently defend their privacy. Bellow is a map of where many isolated tribes or believed un-contacted tribes around the world may be located. These tribes have every right to their land and there culture and should not be distrubed if they do not wish to be(6).

Ethnic Diversity
Ethic diversity gives the world its unique spread of peoples around this great world. It is hard to say where the most and the least ethnic diversity may be in the world because there are so many small ethnicities and it is not always easy to define ethnic groups. however, one paper did do some research to try and shed some light on ethic fractionalizations around the world(7). Possibly the most ethnicities may be located within the Sub-Saharan Africa region with many many small dialects and tribes to make up a very diverse region(7). The least ethnic region may be Western nations with many groups using the same languages and religions, however the argument has been made that these are still diverse nation due to many ethnicities moving to countries such as the United States and becoming a melting pot. Again, it is hard to gauge ethnicity around the world.
INTERESTING FACTS
highest life expectancy by country based on United Nation data(8)
1. Japan - 82.6
2. China - 82.2
3. Iceland - 81.8
4. Switzerland - 81.7
5. Australia - 81.2
6. Spain - 80.9
7. Sweden - 80.9
8. Israel - 80.7
9. Macau - 80.7
10. France - 80.7
World City furthest from a body of water
the city of Urumqi is roughly 3,270 km from a body of water(9)
10 most polluted cities in the world
the link below is to a google earth map with information on the 10 most polluted cities
http://www.mibazaar.com/pollutedcities.html
Dirtiest Bodies of Water in the World
these are not ranked because it is hard to determine the dirtiest(10)
Lake Victoria Africa
-sewage is released into this lake and can give several diseases to anyone who comes in contact with the water
Citarum River Indonesia
-industrial waste and garbage; perhaps one of the most polluted bodies of water in the world
Great Lakes US/Canada
-auto industry, oil industry, and other industrial waste
Yellow River China
-chemical spills
Matanza-Riachuela River Buenos Aires
-"worlds largest open pit toilet"
Lake Onondaga US
-Several chemical pollutants including Phosphorus, nitrate, ammonia, and more
Sarno River Italy
-agricultural and sewage runoff
Lake Karachay Russia
-radioactive waste
Population of the World

RESOURCES
1. Cia - the world fact book. (last updated 2011, May 17). Retrieved from https://www.cia.gov/library/publications/the-world-factbook/geos/xx.html#Geo
2. Gleick, P. (2009). The worlds water. Chicago: Island Press.
3. Birkeland, Peter W. Soils and Geomorphology, 3rd Edition. New York: Oxford University Press, 1999.
4. The world population. (last updated 2011, March 26). Retrieved from http://www.internetworldstats.com/stats8.htm
5. The world population. (2011, March 26). Retrieved from http://www.internetworldstats.com/stats8.htm retrieved from http://www.census.gov/prod/cen2010/briefs/c2010br-01.pdf
6. Survival international. (2011). Retrieved from http://www.survivalinternational.org/
7. Fearon, James. (2003). Ethnic Structure and Cultural Diversity around the World:
A Cross-National Data Set on Ethnic Groups. American Political Science Association. Boston. p1-39.
8. United Nations, Economics & Social Affairs. (2007).World population prospects (ESA/P/WP.202). New York, NY:
9. China information: urumqi city. (2008). Retrieved from http://arch1design.com/China1Urumqi_City.html
10. Underwood, K. (2009, June 10). Worlds dirtiest rivers and lakes. Retrieved from http://www.treehugger.com/galleries/2009/06/worlds-dirtiest-rivers-and-lakes.php?page=1
No comments:
Post a Comment